Leaderboard
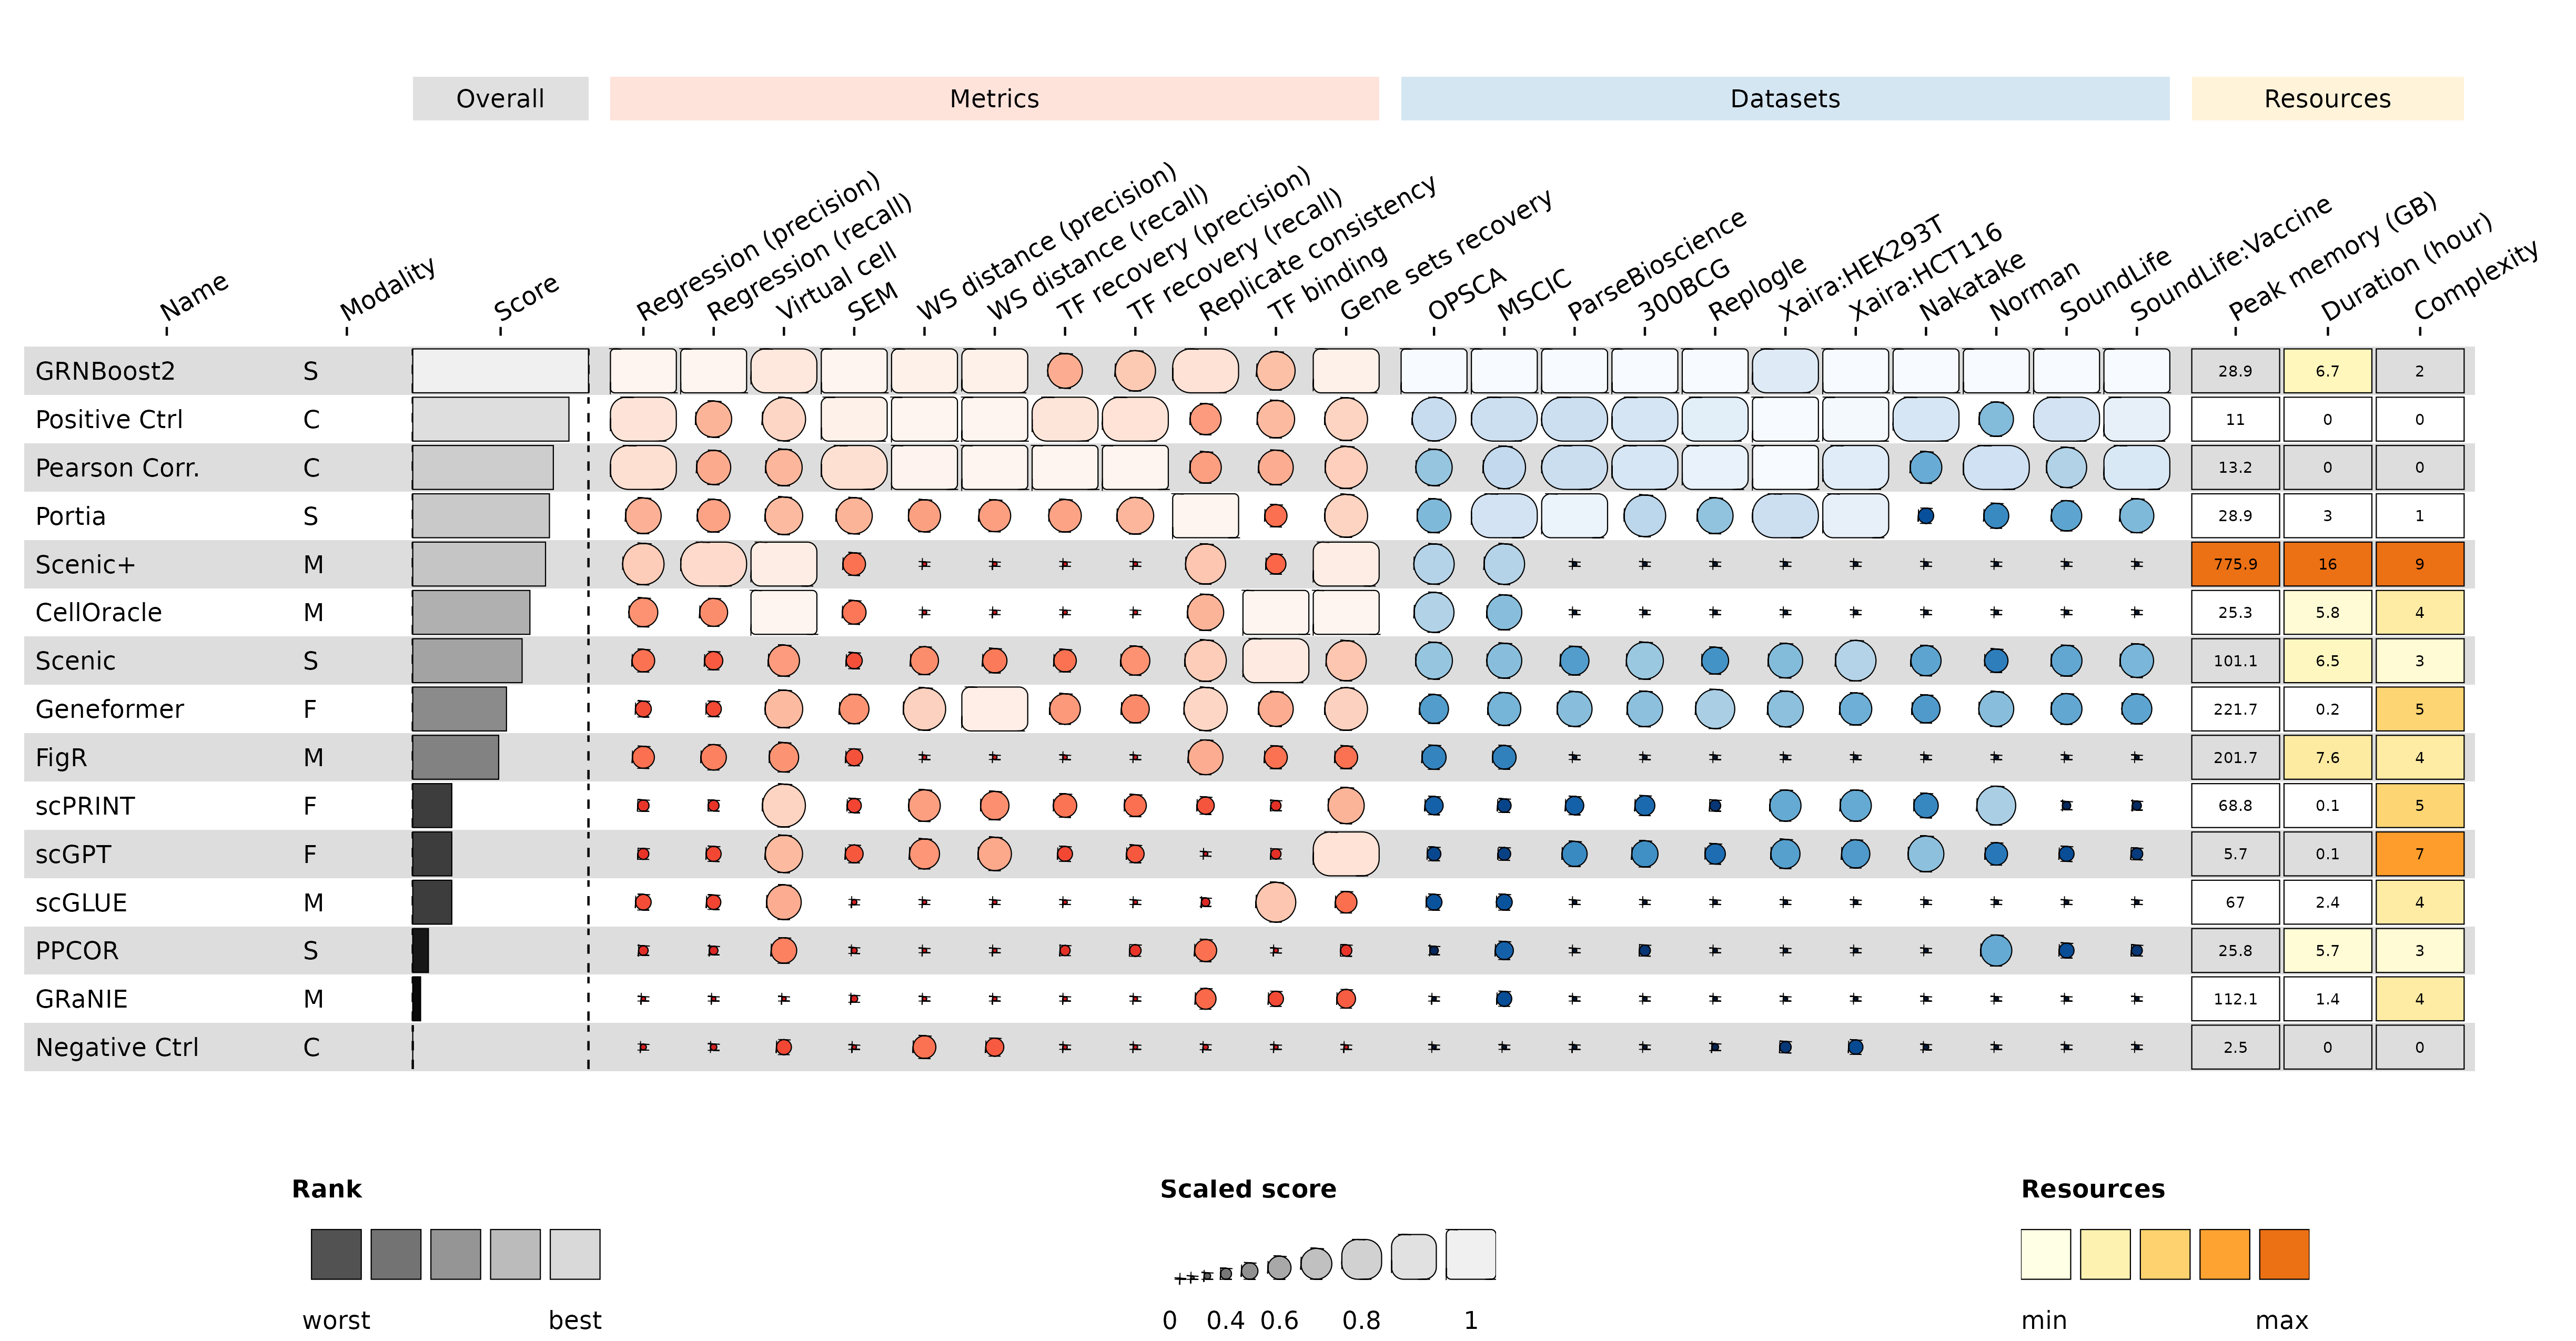
The overall comparative performance of the integrated GRN inference methods is summarized below. Only metrics that pass the applicability criteria for a given dataset are used to rank the methods.
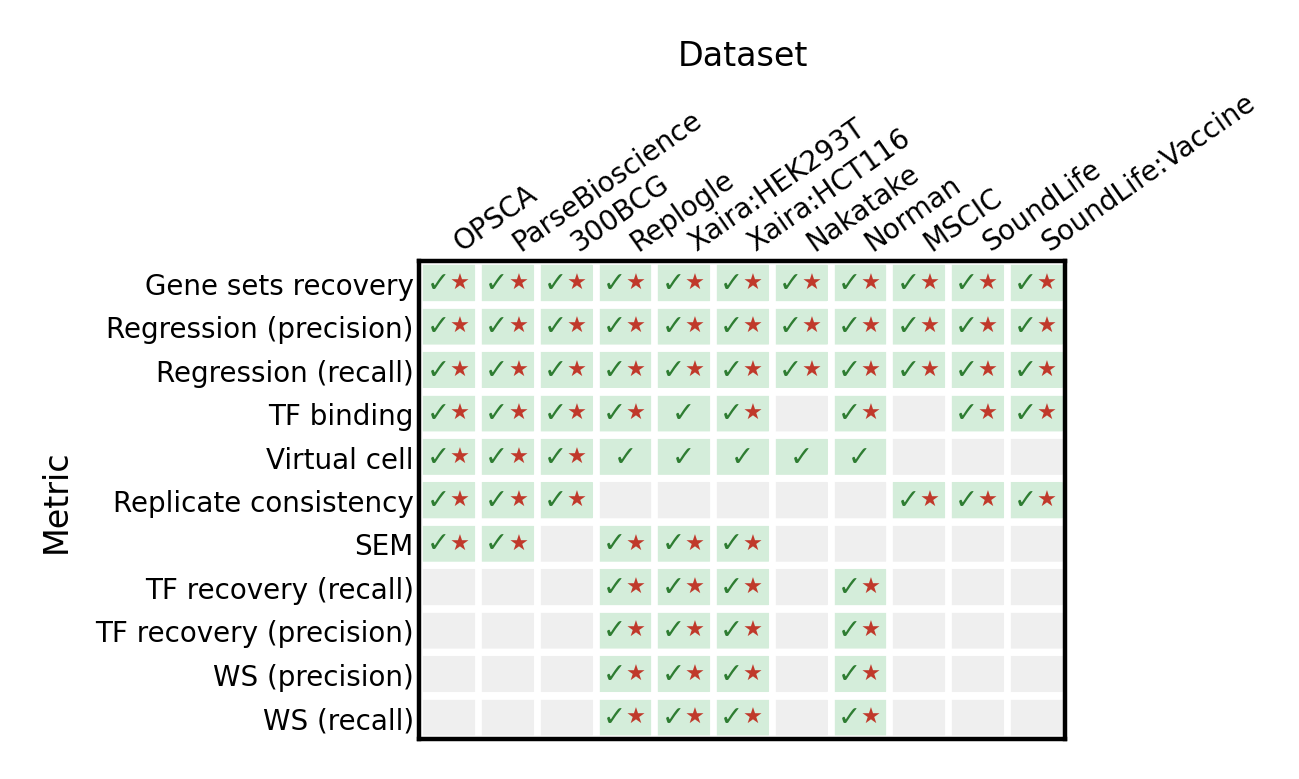
The table below shows which metrics are applicable per dataset (✓ = applicable by metric requirements; ★ = also passes quality criteria).
Overall score normalization
The overall leaderboard score is computed in three steps:
Per-dataset min-max normalization — for each metric within each dataset, raw scores are clipped to zero for negative values and scaled to [0, 1] across methods.
Percentile ranking — methods are ranked by percentile across all applicable (dataset, metric) pairs (1 = best).
Modality-balanced aggregation — the final overall score is the mean of per-modality median percentile ranks (transcriptomics and multiomics datasets contribute equally, regardless of how many datasets exist in each modality). Methods that are not applicable to a modality are excluded from that modality’s rank.
This ensures that a method with strong transcriptomics performance is not penalized simply because there are more transcriptomics datasets than multiomics ones.
Summary
Raw scores per dataset
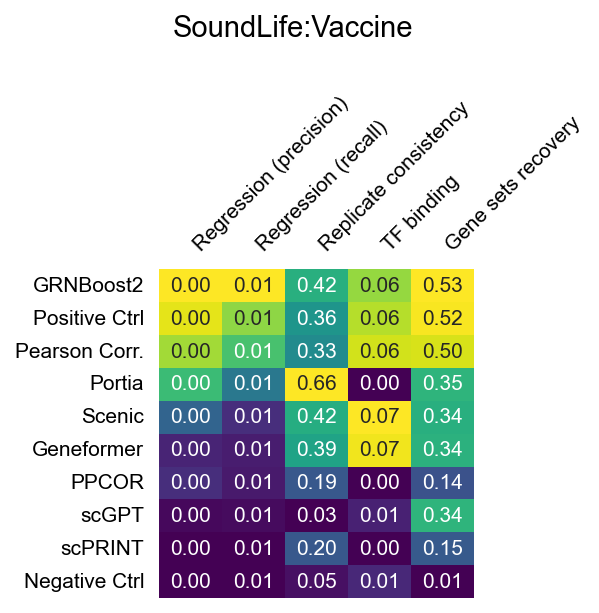
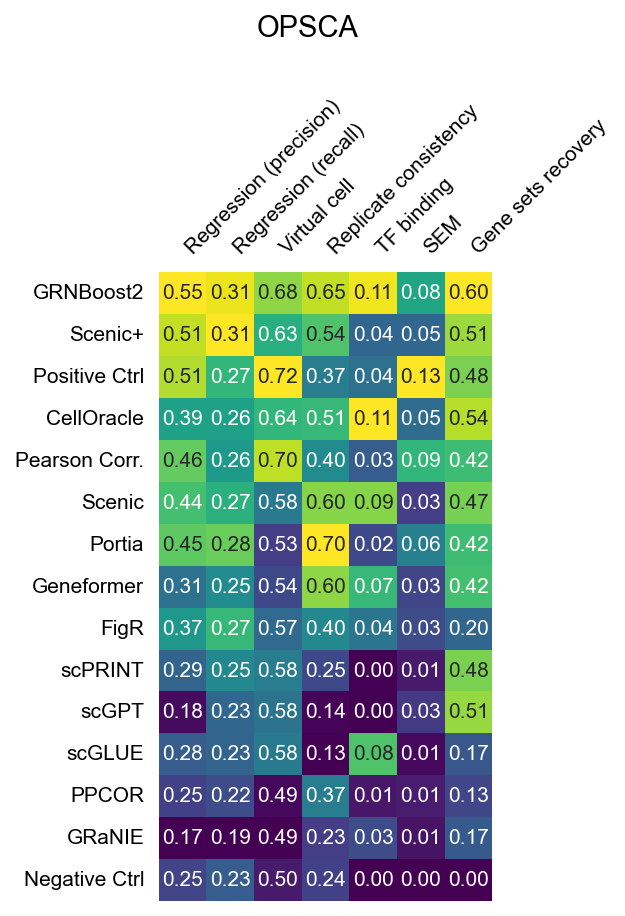
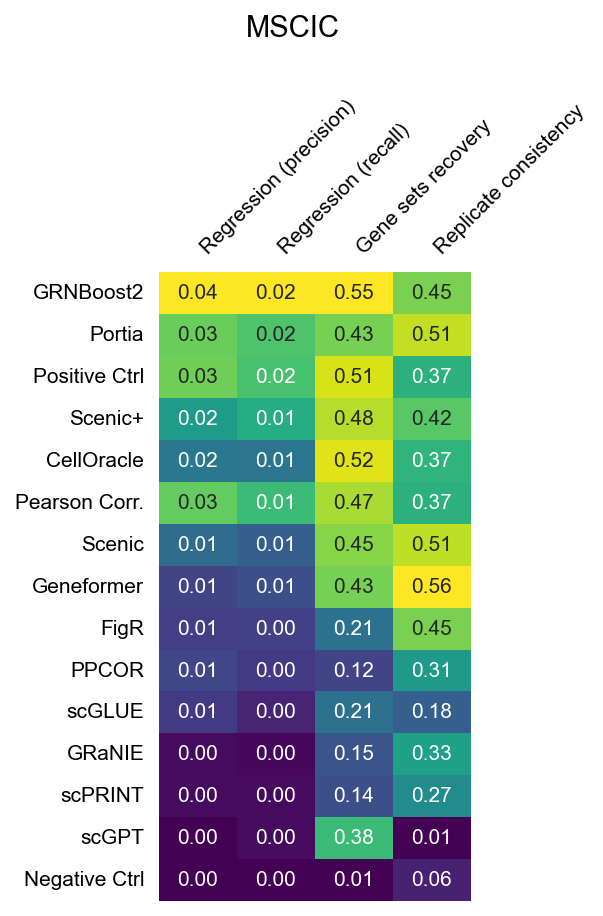
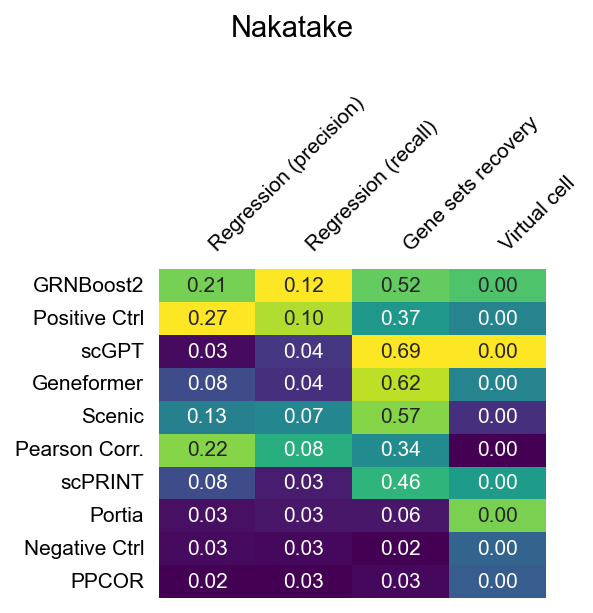
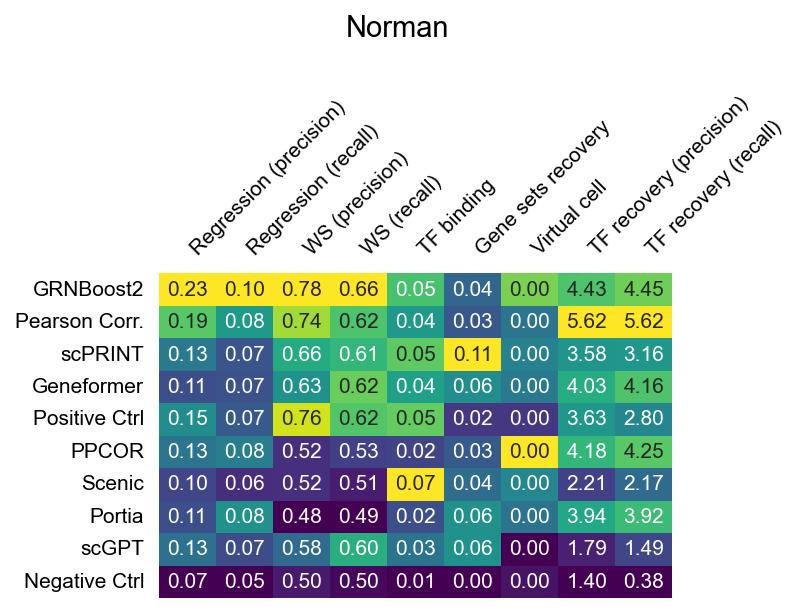
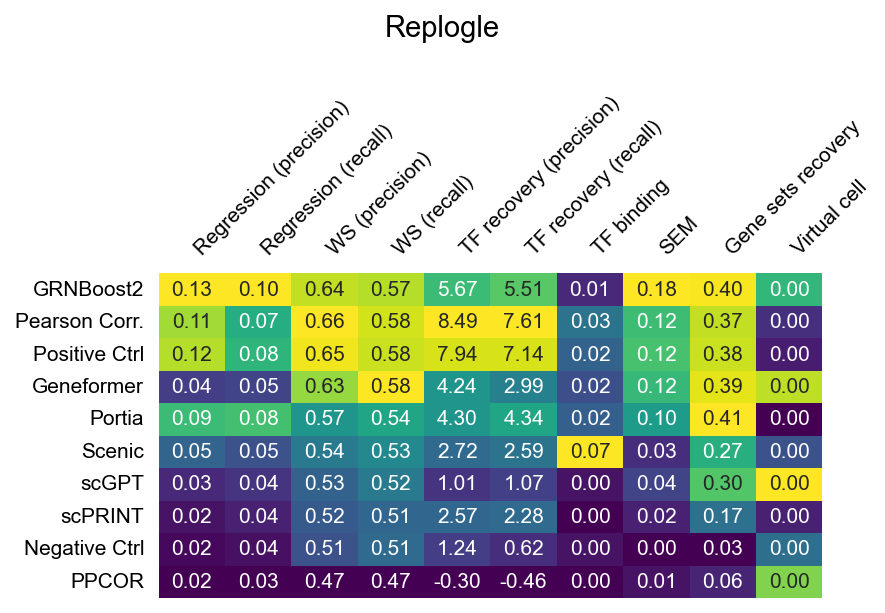
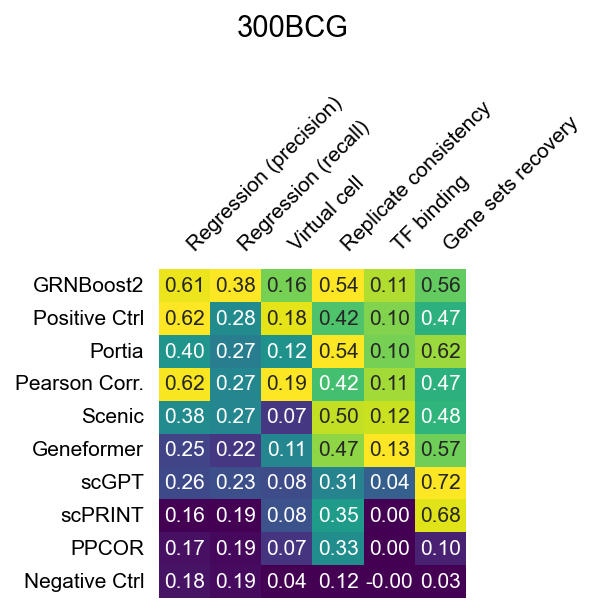
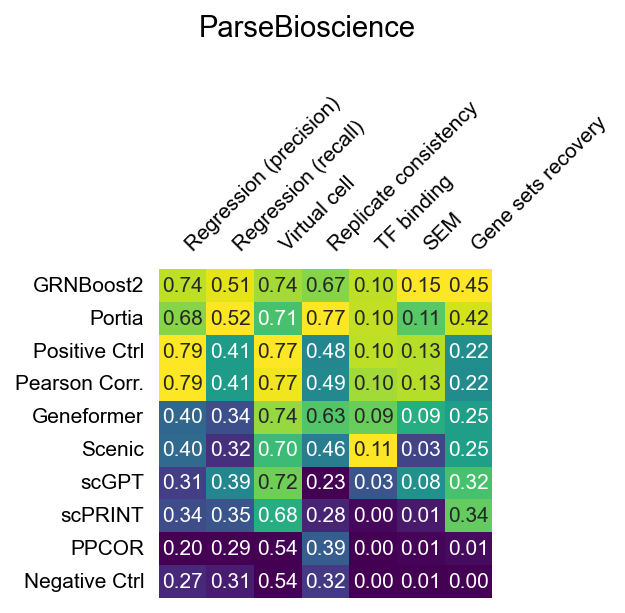
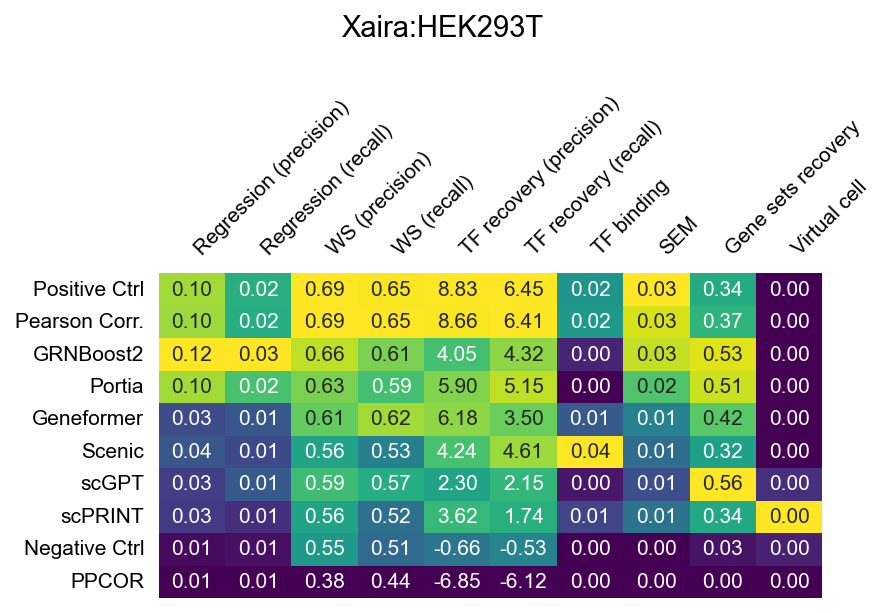
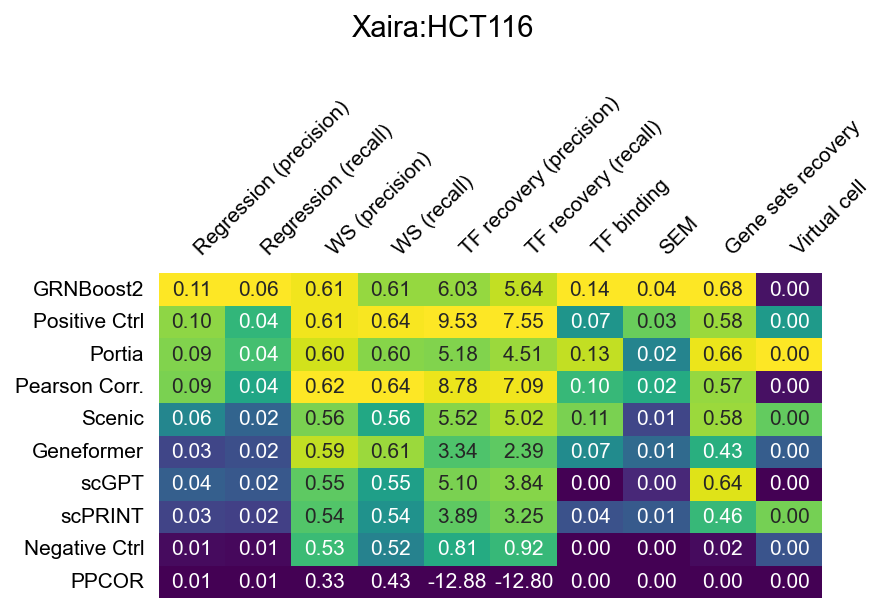
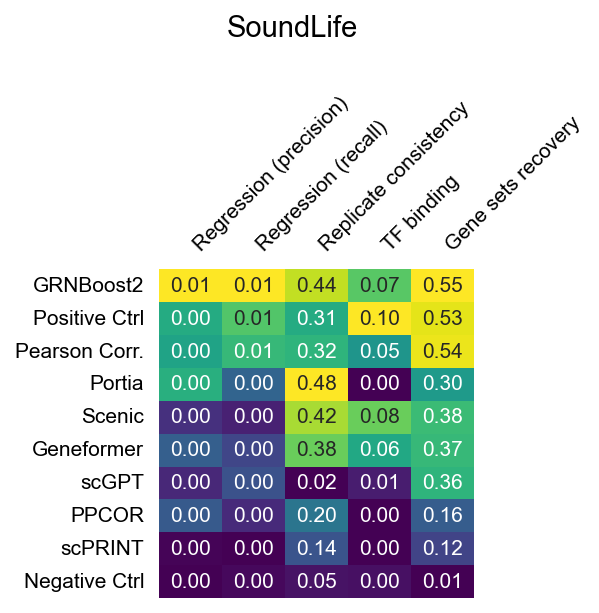
The heatmaps below show raw (unnormalized) metric scores for each dataset. Rows are GRN inference methods; columns are individual sub-metrics. Color represents the raw score value — higher is better for all metrics. Grey cells indicate that a metric is not applicable to that dataset or that the method did not produce a valid result.
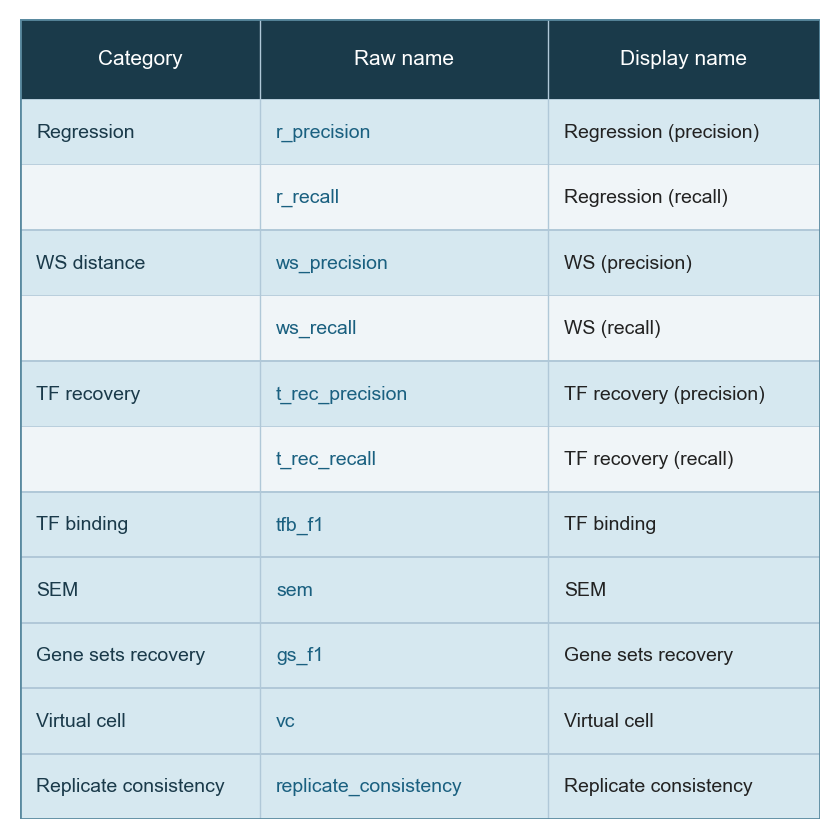
Note that sub-metric names in these heatmaps differ from the display names used in the leaderboard. See surrogate_names in src/utils/config.py for the mapping.
Multiomics datasets
OPSCA (PBMC, drug perturbations — scRNA + scATAC)
MSCIC (BMMC, observational — snRNA + snATAC, 10x Multiome)
Transcriptomics datasets
Nakatake (PSC, TF overexpression)
Norman (K562, CRISPRa activation)
Replogle (K562, CRISPRi knockout)
300BCG (PBMC, chemical perturbations)
ParseBioscience (PBMC, cytokine stimulation)
Xaira HEK293T (HEK293T, CRISPRi knockout)
Xaira HCT116 (HCT116, CRISPRi knockout)
SoundLife (CD4 T cells, longitudinal observational)
SoundLife: Vaccine (B cells, flu vaccination)